Microsoft Power BI is a product and service package for individuals and teams, including business intelligence (BI), reporting, and data visualization.
With the Power BI package of business intelligence tools, you can monitor your business effectively and obtain quick answers with rich data visualization and great dashboards.
The world of business intelligence has been simplified with the introduction of Power BI, a fast and straightforward business intelligence application for excellent data visualization. This Microsoft Business Analytics tool combines raw data from various sources, ranging from a simple spreadsheet on a desktop to cloud-based data. Due to its adaptability and low training requirements, it can be used even by those with a lack of technical knowledge to evaluate and exchange data visually. This qualifies it for advanced modeling, real-time analytics, and bespoke development.
SYNOPSIS
- Power BI is a business analytics tool that enables you to visualize and share data throughout your organization and integrate insights into your app or website.
- Simple to learn if you are already familiar with Excel’s Power Pivot and Power Query functions.
- Because Microsoft powers this Business Intelligence tool, you can always benefit from and network with other clients regarding suggestions and exercises.
INTRODUCTION TO POWER BI
Microsoft Power BI is a product and service package for individuals and teams, including business intelligence (BI), reporting, and data visualization. Power BI is distinguished by its simplified publishing and distribution capabilities and its connectivity with other Microsoft products and services.
Power BI Service
The Microsoft Power BI service is a secure cloud-based application that enables users to access dashboards, reports, and Power BI apps – a type of content that integrates linked dashboards and reports — via a web browser or mobile apps for Windows, iOS, and Android.
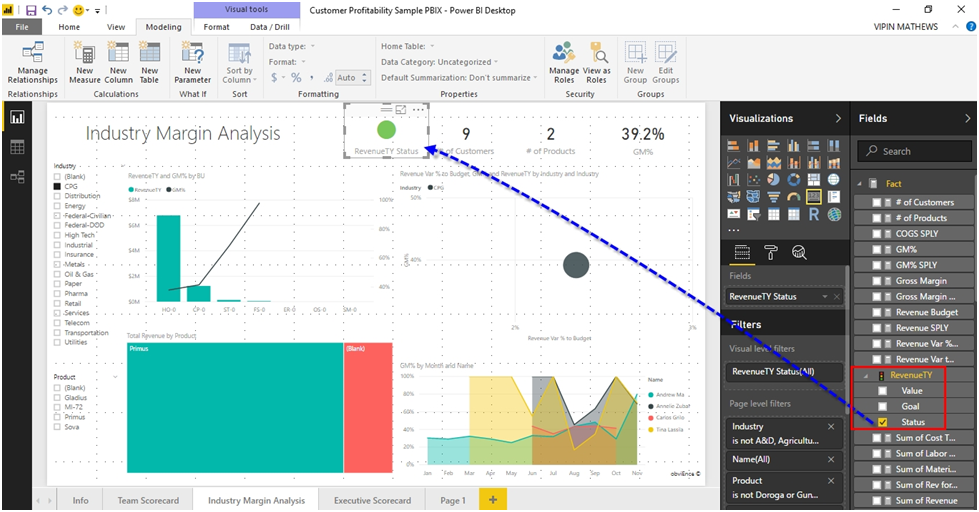
Power BI Desktop
Power BI Desktop is a no-cost self-service data analysis and reports publishing tool for Windows computers. It connects to over 70 on-premises and cloud data sources to transform data into interactive graphics. Data scientists and developers create reports and make them available to the Power BI service using Power BI Desktop.
Power BI Report Server
Report Server is a report server that is installed on-premises. You can produce reports in Power BI Desktop or Pro, and viewers can access them via Report Server via a web browser, mobile device, or email. Report Server would be advantageous for a business that has cloud usage constraints.
Power BI Mobile
Users can connect to and interact with data using Power BI’s mobile apps for iOS, Android, and Windows 10 mobile devices.
Power BI Embedded
Power BI Embedded enables developers to integrate Power BI dashboards and reports into other apps, either within their organization — which needs users to sign in with a Power BI account — or for a client or customer who does not have a Power BI account.
Among Power BI’s primary features are the following:
- The hybrid deployment support enables the business intelligence tool to connect to several data sources and automates analytics to data by using the Quick Insights function to create data subsets.
- Power Query is a web service that enables the integration and manipulation of data into Power BI. For more excellent data visualization, this data can be shared between many users and models.
- The shared data paradigm enables the creation of extendable database structures (schemas).
- Customization allows users to alter the appearance of data visualization tools and add new tools to the platform.
- Through the Power BI APIs, the Power BI dashboard may be embedded in other software applications.
- Complex data models—Using the modeling view, they can be separated into different diagrams. Common properties can be configured, examined, and adjusted as needed.
Power BI’s best-kept secret for effective data visualization:
- Power BI Desktop connects to data sources and generates reports using the business intelligence tool.
- Power BI Desktop reports are published to the Power BI service and shared with end users via the service and mobile devices for viewing and analysis.
Who can use Power BI?
While Power BI is a self-service business intelligence solution that empowers employees with data analytics capabilities, it is mainly utilized by data analysts and business intelligence specialists who construct data models before publishing reports throughout the firm. Those without an analytical background, on the other hand, can still use Power BI and create reports.
Both department representatives and management utilize Microsoft Power BI. Reports and predictions are prepared to assist sales and marketing representatives while also providing information about how the department or individual employees perform toward their goals.
Additionally, Power BI has an administrator interface that enables administrators to modify Power BI’s implementation and monitor usage and licenses.
Final Verdict
Analysts and other users can use Power BI Desktop to develop data connections, models, and reports. The Power BI service is used to share messages with other users, allowing them to view and interact.
Connecting data sources is the first step in creating a Power BI report. Users then query the data to generate reports tailored to their own needs. The information is published to Power BI Service and shared with other Power BI users so that cloud and mobile users can view and interact with it. Permissions can be added to enable or restrict colleagues’ access to alter reports or create dashboards.

3 Comments
Tesha
Hi! Would you mind if I share your blog with my twitter group?
There’s a lot of people that I think would really appreciate your
content. Please let me know. Thanks
IT Surrey Ltd
Hi Tesha,
Feel free to share our blogs, all we would ask is that you share it via our website rather than copying any content.
May I ask how you have come across our website/blog?
Many thanks,
Steve
IT Surrey Ltd
Imogene
It’s a shame you don’t have a donate button! I’d without
a doubt donate to this fantastic blog! I suppose for now i’ll settle for bookmarking
and adding your RSS feed to my Google account.
I look forward to brand new updates and will talk about this site with my Facebook group.